

Dorkington
-
Posts
14,189 -
Joined
-
Last visited
Content Type
Gallery
Profiles
Forums
Events
Everything posted by Dorkington
-
Slackers. They should be cut immediately.
-
Cassel advantage and explanation of EJ's command issues
Dorkington replied to Vinaccia's topic in The Stadium Wall Archives
So EJ can't be a leader because he makes mistakes. Yet has similar numbers as Cassel, who can be a leader, because he makes mistakes, but played for the Patriots? -
Can you imagine the Bills/NFL trying to do this?
Dorkington replied to \GoBillsInDallas/'s topic in Off the Wall Archives
I remember going to baseball games as a kid, and we could go in early and watch warmups with no problem. Did that change with the MLB, or is it dependent on venue? -
Are we going to cut everyone that doesn't show up for Voluntary Workouts this year?
-
Would you trade for Andy Dalton?
Dorkington replied to YoloinOhio's topic in The Stadium Wall Archives
Dalton has certainly made it to the playoffs more often than our current QBs, so I wouldn't be opposed. But I also don't see him winning a SuperBowl without an elite defense, and strong special teams. -
Average Income Lower Than Previous Year
Dorkington replied to Dorkington's topic in Politics, Polls, and Pundits
Things I've read have basically all said stagnation started happening 15-30 years ago. I mean if it's all the Democrats fault, I'm open to hearing arguments about it... but I don't think it's specifically only an Obama problem. -
Average Income Lower Than Previous Year
Dorkington replied to Dorkington's topic in Politics, Polls, and Pundits
It's interesting that this is specifically an Obama problem, when this trend has been happening for much longer than he's been in office. -
Sounds like she's a closet bigot. Too bad she didn't set up a GoFundMe... The Memories Pizza folks ended up with $842k.
-
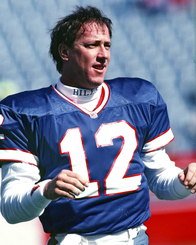
How is this an excuse. EJ should be benched for not throwing to his number 1, no matter the situation.
-
Indiana allows what it allows, and doesn't necessarily line up with my opinion of discrimination.
-
It's still discrimination in my book, you'd have to consult a judge on if it were discrimination according to the law.
-
We won the first half of the offseason! EVEN BETTER
-
People, because they are fine with the event (the act of marriage), but not fine with the people involved (gay couple).
-
If they said "no marriages" at all that wouldn't be discrimination. But if they said "we'll do marriages, just not gay ones", that'd be discrimination in my book.
-
There are certainly religious organizations that are against interracial relationships. An extreme example would be the KKK.
-
Didn't we win the offseason when we signed Mario?
-
No one, personally, has to accept anyone/anyone's marriage. Businesses that refuse business based on personal views get into sticky territory. Putting a sign out front that says "no gays" is no different than "no blacks" imo. Not that many/any are going that far, but it's the easiest way to present my opinion.
-
Average Income Lower Than Previous Year
Dorkington replied to Dorkington's topic in Politics, Polls, and Pundits
Insurance prices going up (as they do every year) + more people buying insurance due to the mandate makes the increased insurance spending pretty logical, imo. -
Businesses that openly refuse business interracial marriages don't get in trouble?
-
Article: Quit Sleeping on EJ Manuel
Dorkington replied to YoloinOhio's topic in The Stadium Wall Archives
I have to wonder what would have happened if Goodwin kept running with the catch towards the sideline, vs turning infield. Not saying he wouldn't have gotten tackled, but I feel like the hit would have been minimized. Edit: Nevermind, it was behind him. On first watch, it looked like he stopped to turn up field after the catch. -
The same reason people are forced to accept interracial marriage, I assume.
-
Once again, the Bills have won the offseason. It's good to be kings.
-
Their GoFundme is at $600k right now. So their anti-gay wedding stance has certainly paid off.
-
__________________________________________________________________________________________ Average annual expenditures Income before taxes July 2012- July 2013- Percent July 2012- July 2013- Percent Income quintile June 2013 June 2014 change June 2013 June 2014 change ---------------------------- ---------- -------- ---------- ---------- ------- Lowest 20th $22,336 $22,981 2.9 $10,174 $9,818 -3.5 percentile Second 20th 33,075 32,778 -0.9 27,094 26,369 -2.7 percentile Third 20th 42,728 43,739 2.4 47,017 45,724 -2.8 percentile Fourth 20th 59,155 59,250 0.2 75,990 74,410 -2.1 percentile Highest 20th 99,651 100,979 1.3 164,647 166,048 0.9 percentile _________________________________________________________________________________________ Other than the highest 20th percentile, everyone's income has gone down. In some of the cases, combined with increased cost of living. What are your thoughts on this? What is causing this? More info below: http://www.bls.gov/news.release/cesmy.nr0.htm
-
What an injury riddled bust.